Important: The Opportunities Dashboard requires the Professional or Corporate Edition of QuoteWerks. This dashboard is also available in the trial version of QuoteWerks. |
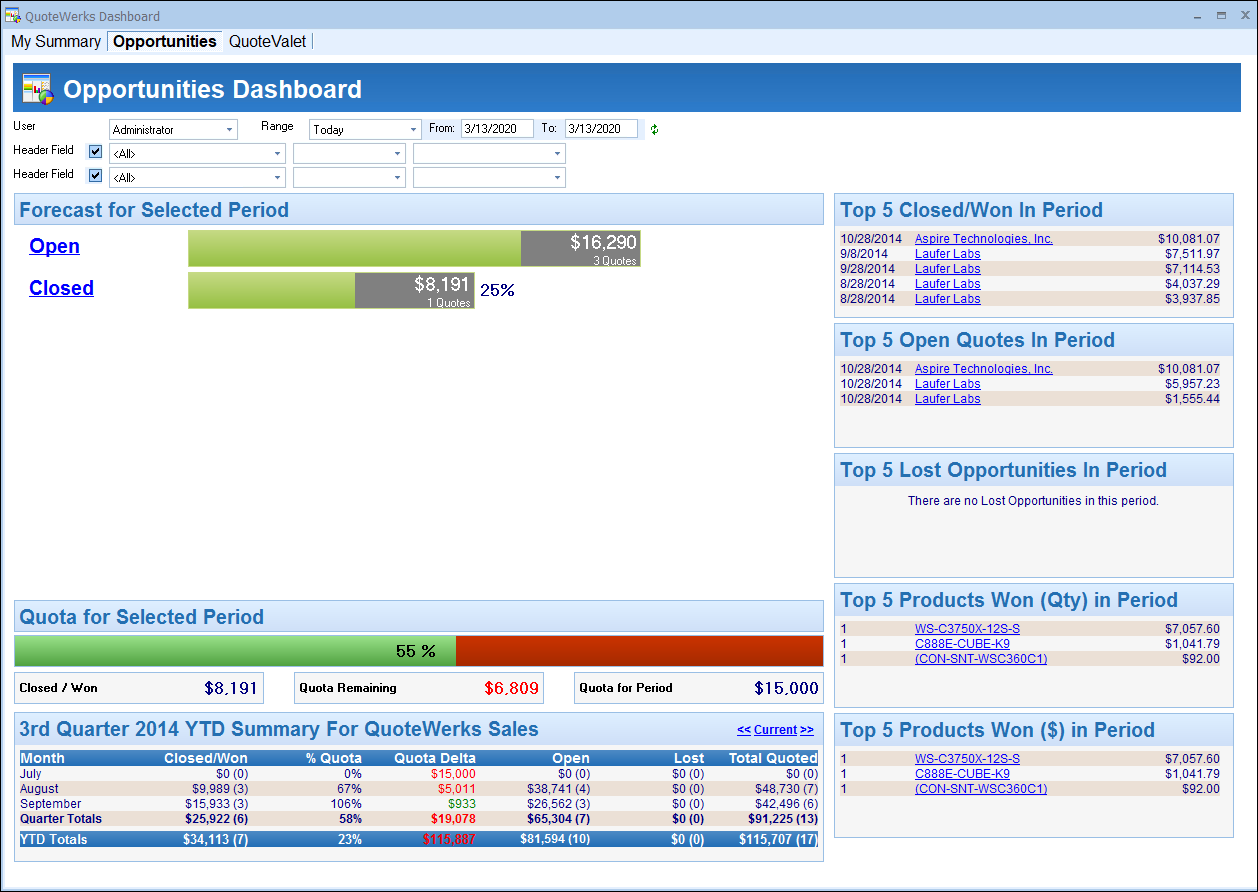
The Opportunities Dashboard displays real-time sales data from the active and closed quotes in QuoteWerks. This dashboard provides sales reps and management with insight into the QuoteWerks documents including top selling products, various stages of quotes, quarterly progress, quota achievement and more. Additionally, users will be able to automatically track opportunities instantly and accurately as the data that is used to create opportunities in a CRM system, is based on the quote in QuoteWerks.
Using the User, Range, and two Header Fields, allows users to see (with proper security settings) another users opportunities in QuoteWerks or their own. You can use the Header fields to filter down onto specific document information such as expiration dates, deposit amounts, margins, and many more.
The Dashboard will also remember the previously selected User (or group), date range, and header field selections.
Forecast for Selected Period
The Forecast for Selected Period will display the number of quotes with a status such as open, lost, and closed/won for the selected user or group and date range. The open quotes will consist of quotes created during the date range and that have not been converted to an order or set as lost. The closed quotes are quotes that have been converted to an order in QuoteWerks during the set date range. Date ranges are limited based on the security settings per user on the Access tab. The Date Range settings are customizable on a per user basis and can be located near the bottom of the Access rights list. The dashboard shares rights settings from QuoteValetInsight .
Users will also only be able to view their quotes unless their Document rights allow them to view other users or groups quotes in QuoteWerks.

Quota for Selected Period
The Quota for Selected Period will display the Closed/Won quotes dollar value for the selected period, the Exceeded Quota amount (if over quota)/ Quota Remaining (if under quota) for the selected range, and the total quota for the period. It will also display a status bar in a percent of the quota amount you have reached or exceeded.
Quarter Summary for Sales Rep
At the bottom left corner of the screen users can see a quarterly summary of their quotes and orders. This summary will display the number and dollar value of the closed/won quotes, the percent of the quota reached, the quota delta (if over the delta the dollar amount over will be in green, if under the delta the dollar amount will be in red), how many open documents remain, how many documents were converted to Lost, and the total number of quotes

|
|---|
Top 5 Closed/Won in Period
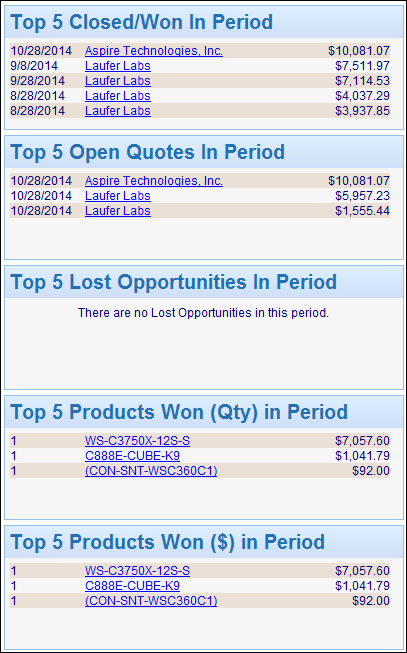
This section, located in the top right of the Opportunities Dashboard, displays the top closed/won opportunities during the selected date range. These documents will be sorted from highest dollar value to lowest.
Top 5 Open Quotes in Period
This section, located on the right-hand side of the Opportunities Dashboard, displays the top 5 quotes open during the selected date range. These documents have not been accepted by the customer (converted to an order) or been set as lost (converted to Lost).
Top 5 Lost Opportunities in Period
This section, located on the right-hand side of the Opportunities Dashboard, displays the top 5 opportunities during the selected date range that were converted to Lost. This means the customer did not accept or move forward with these quotes.
Top 5 Products Won (Qty) in Period
This section, located on the right-hand side of the Opportunities Dashboard, displays the top 5 items sold during the period by quantity. It will display the quantity of the items sold during the selected date range.
Top 5 Products Won ($) in Period
This section, located on the bottom right-hand side of the Opportunities Dashboard, displays the top 5 items sold during the period by dollar amount. This will list the most expensive items purchased by customers for the selected date range.
